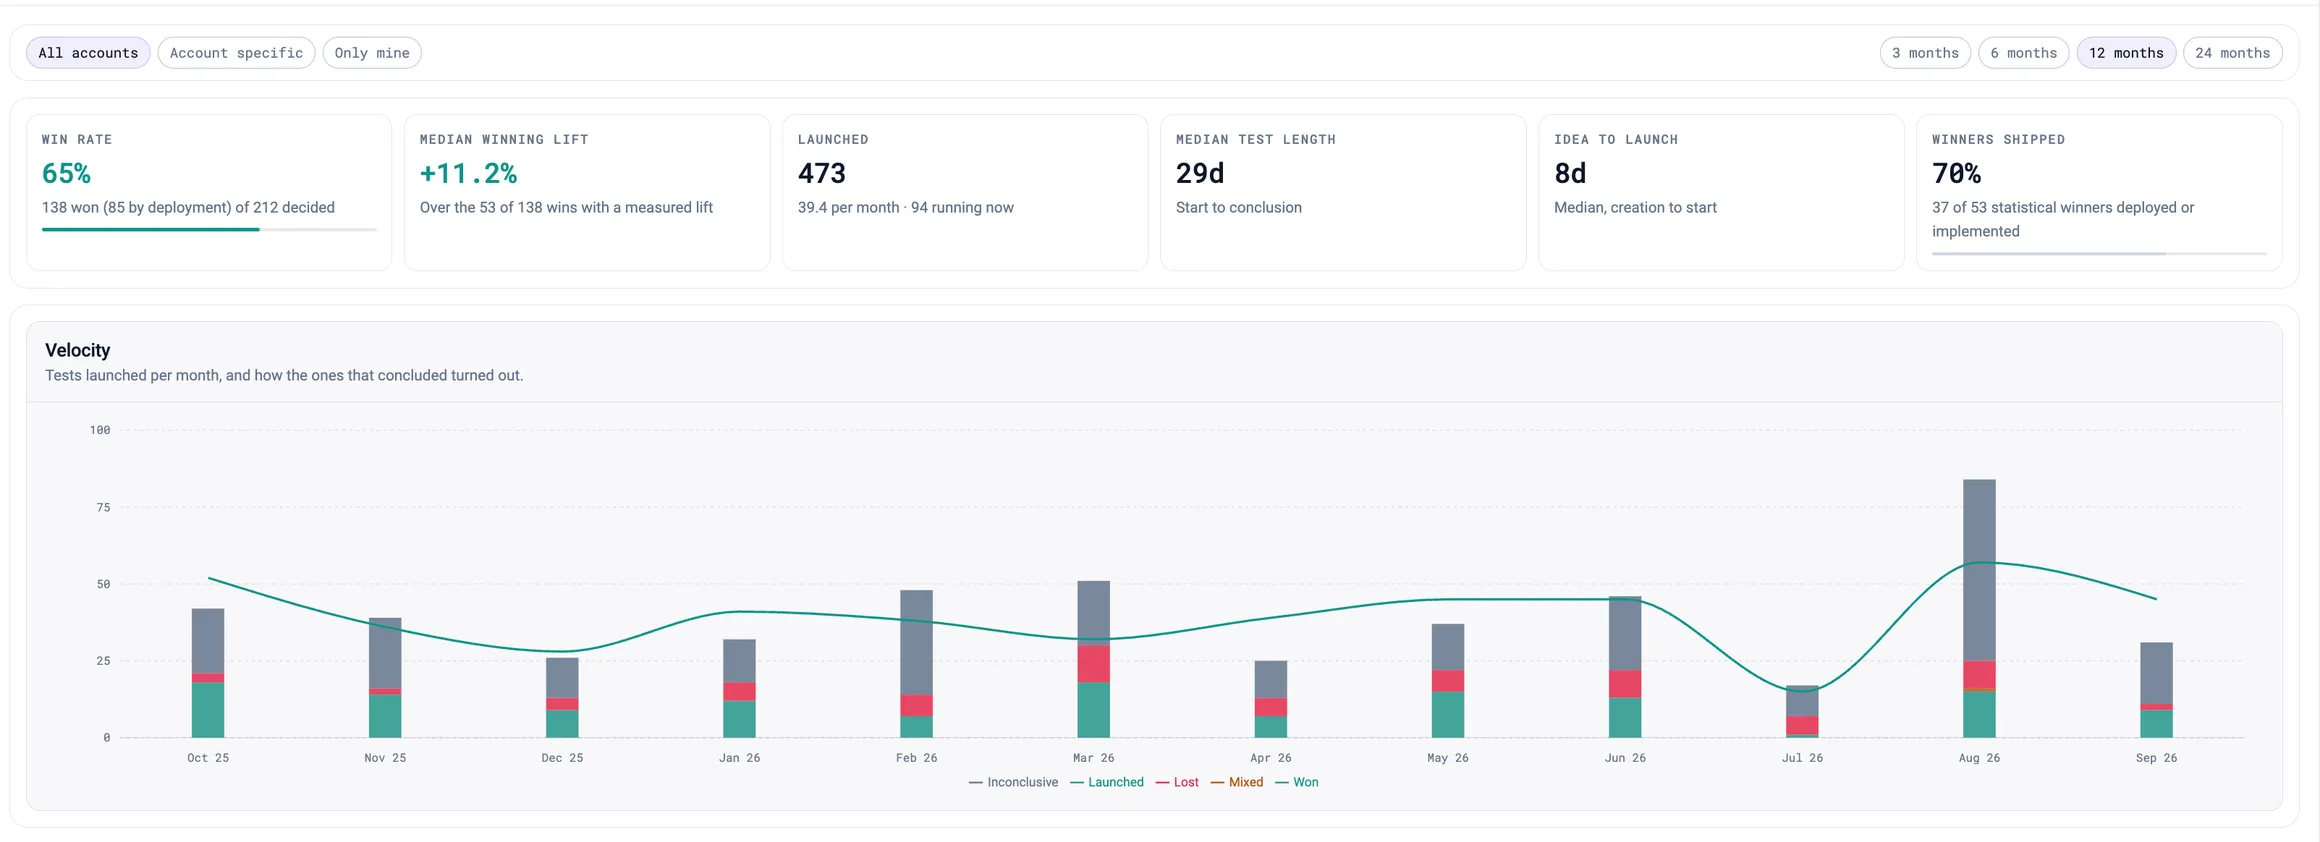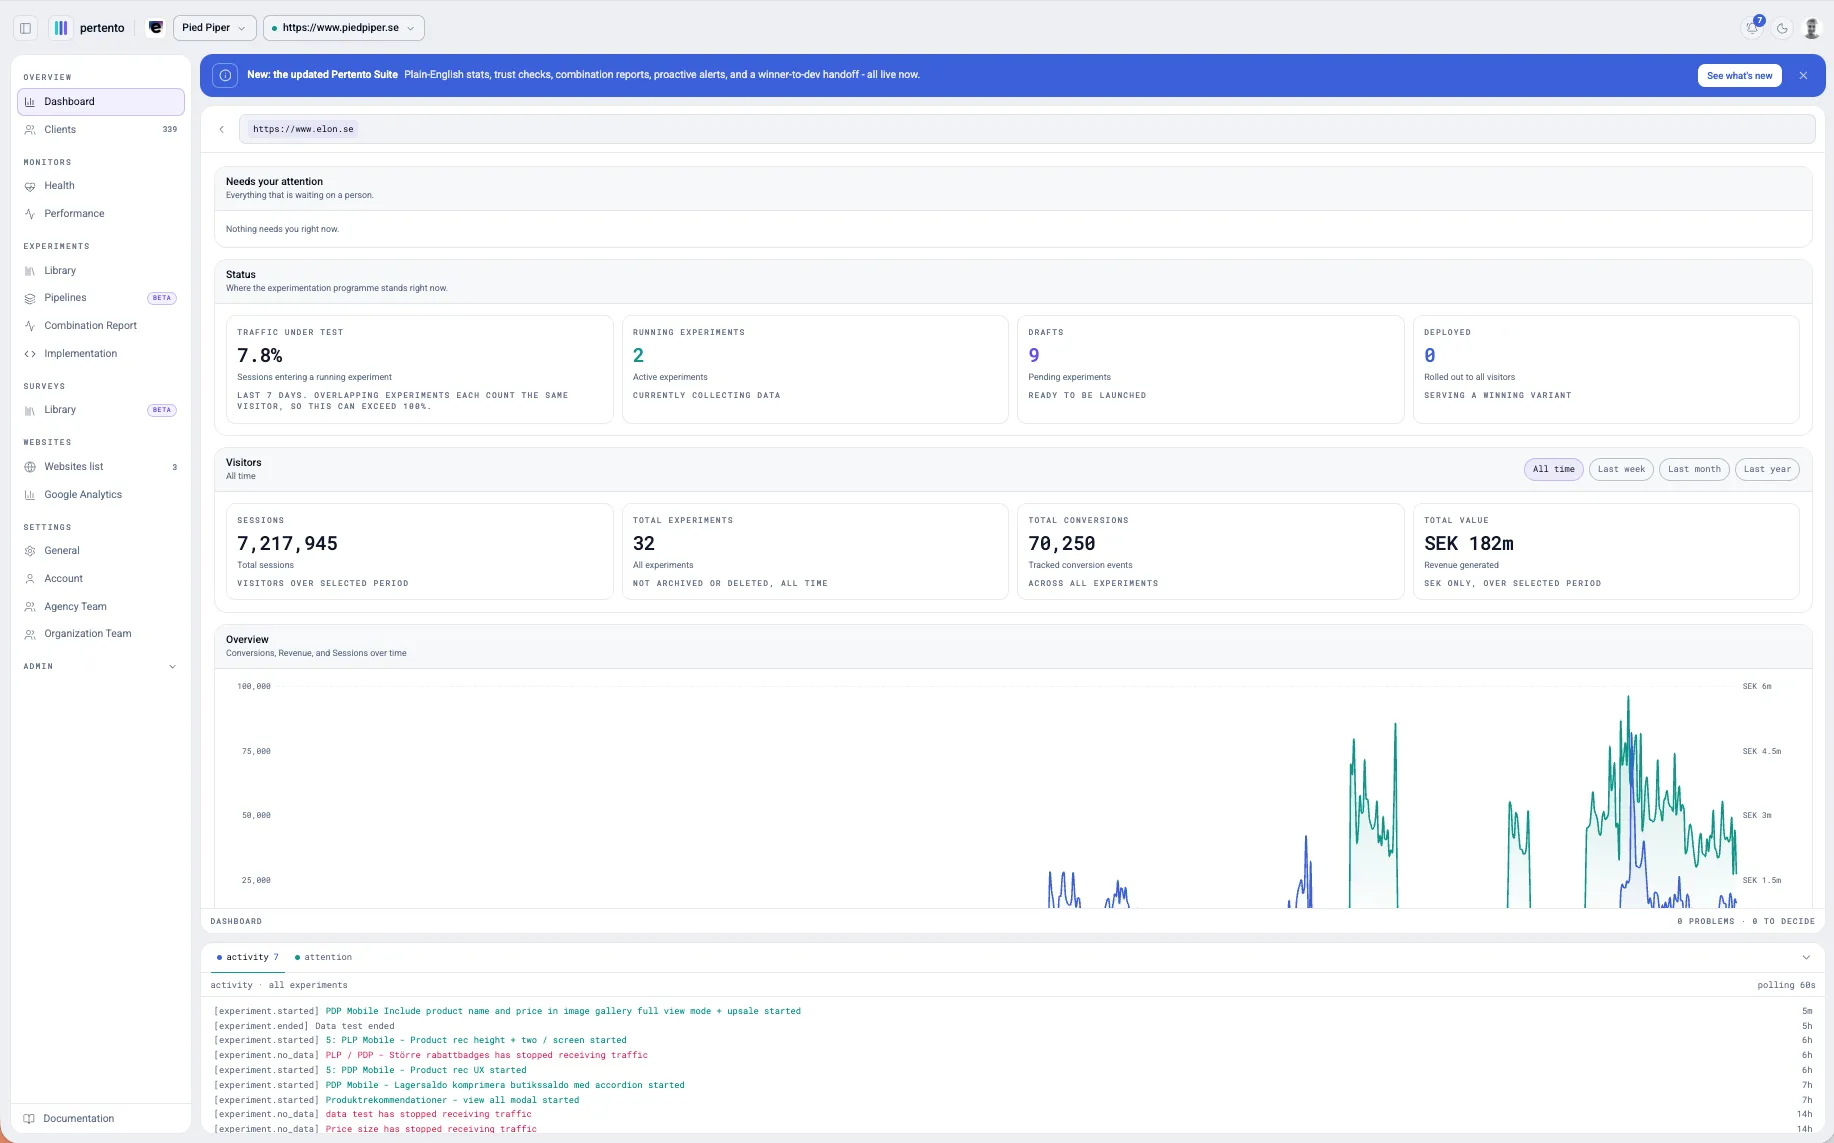
Pertento is no longer just an A/B testing tool. With this release it becomes a full conversion optimization workflow: prioritize ideas, run them, understand the statistics in plain English, catch the tests you cannot trust, see how concurrent experiments affect each other, stay on top of the account without watching it, and hand winners to your developers without leaving the dashboard.
Every A/B testing platform will tell you a number. The hard part was never the number. It was answering the questions that come right after it: Can I trust this? How much longer do I need to run? What do I tell my boss? Which of these twelve ideas do I test first? And who actually ships the winner?
This release is our answer to all of those at once. Here is everything that is new.
1. Statistics that explain themselves
We rebuilt the statistics tab around a simple principle: anyone on your team should be able to read a result out loud and be correct.
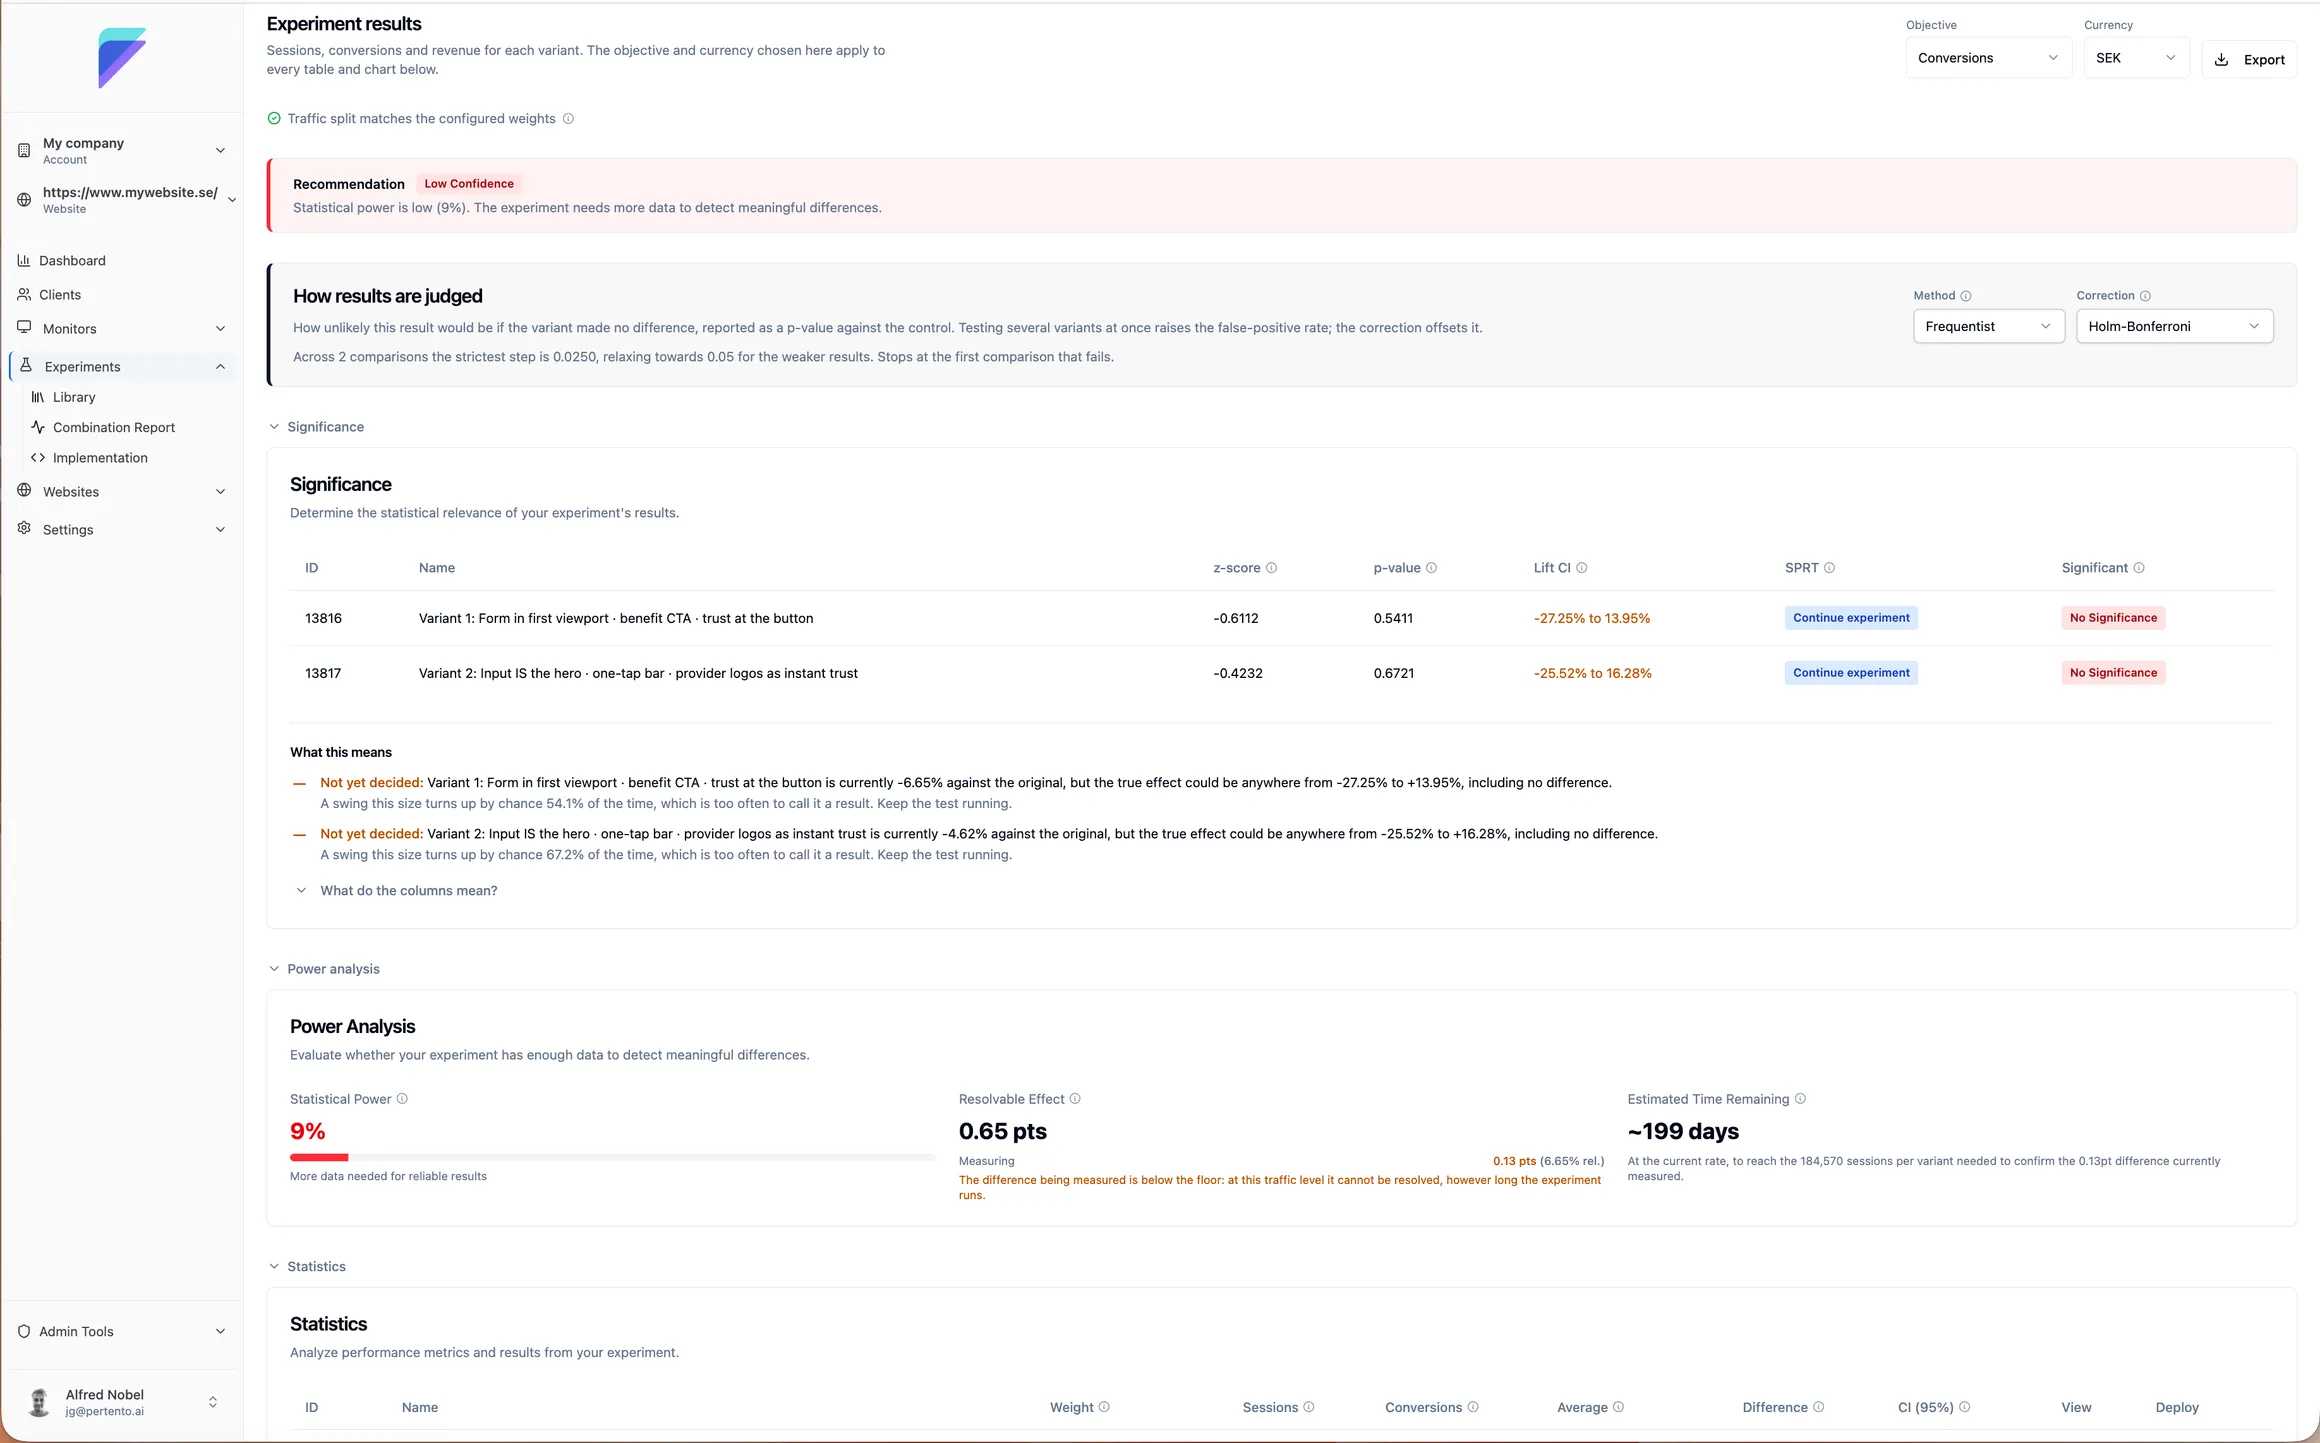
A plain-language verdict for every comparison. Instead of a bare p-value, each variant now gets a written explanation of what the test found, what it does not prove, and how confident you should be. No statistics degree required, and no more guessing what "p = 0.048" licenses you to say in a stakeholder meeting.
Tooltips on everything. Sessions, conversions, revenue, Wilson confidence intervals, lift intervals, z-score, p-value, statistical power, resolvable effect, time remaining, required sample size, probability to be best, expected loss, credible intervals, sequential testing, and every selector on the page. Twenty-six terms, each with a definition written for a marketer rather than a statistician. Hover anything you are unsure about.
A recommendation banner at the top. The headline answer, first: keep running, call a winner, or stop because there is nothing here to find.
2. You choose how results are judged
Different teams have different standards for evidence, and now Pertento respects that instead of hard-coding one opinion.
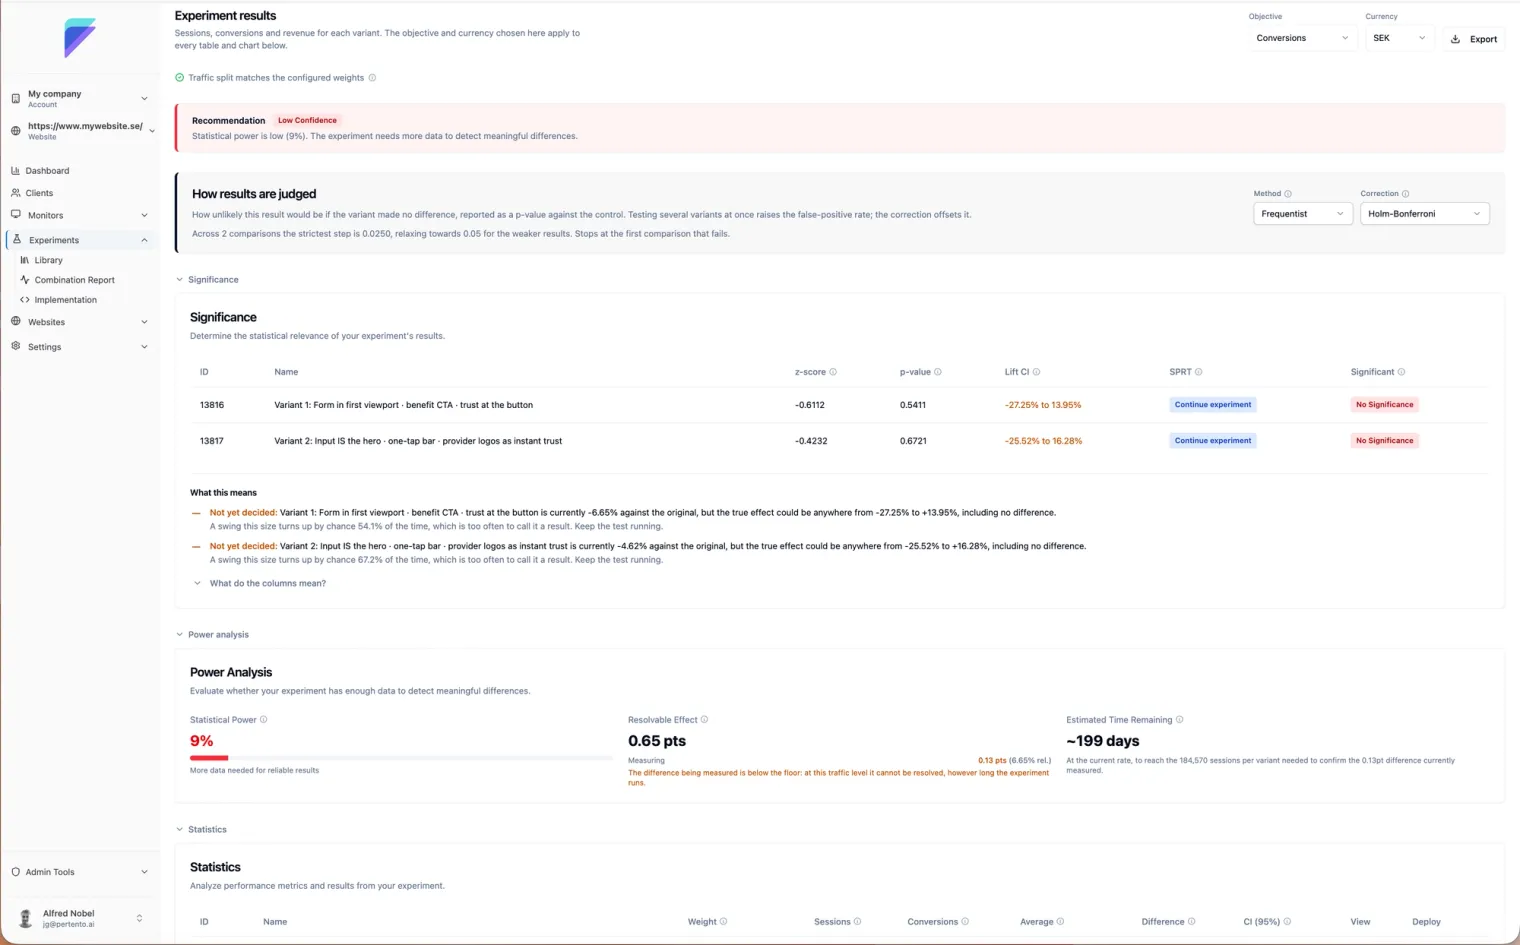
Two evaluation methods. Switch between frequentist (classic significance testing) and Bayesian (probability to be best, expected loss, credible intervals) with a dropdown. Bayesian answers "what is the chance this variant is actually better?", which is usually the question people meant to ask in the first place.
Four multiple-comparison corrections. Testing four variants against a control means four chances to be fooled by noise. Choose Holm-Bonferroni, Benjamini-Hochberg, Šidák, or none, and see the verdicts change accordingly.
Everything recalculates live. Change the objective, the currency, the evaluation method or the correction, and the entire page re-derives: the table, the significance verdicts, the charts, the power analysis and the recommendation. Switching currency genuinely re-runs the numbers on that currency rather than relabeling them.
A sticky control bar. Scroll past the "How results are judged" section and the objective, currency and method selectors follow you down the page, so you can change an assumption without scrolling back to the top.
Collapsible sections. The statistics page is now genuinely deep, so every report block folds away. Open only what you are working on.

3. Power analysis: stop guessing how long to run
The most expensive mistake in experimentation is calling a test that never had a chance of detecting the effect you were hoping for.
The new power analysis panel shows:
- Current statistical power, so you know whether a "no difference" result means anything at all
- Minimum detectable effect, the smallest lift your current sample could reliably find
- Maximum detectable effect alongside it, so you can see the range you are actually able to resolve
- Required sample size to hit your target
- Projected days remaining at your current traffic rate
If a test needs another eleven days to be conclusive, the page now says so, before someone declares victory on day three.

4. Sample ratio mismatch: the check that catches broken tests
If you configured a 50/50 split and the data shows 54/46, something is wrong. Not with the variant, with the experiment. A redirect that fails on mobile, a bot filter, a caching layer, a targeting rule that fires late.
Pertento now runs a chi-square goodness-of-fit test against your configured traffic weights on every experiment and flags any meaningful deviation. This is the single highest-value trust check in experimentation and it is now automatic. When it fires, treat the result as suspect until you find the cause.
5. See the whole story, not just the final number
An experiment is a story over time, and a single summary row hides the plot. Two new chart views:
Daily view. Conversion rate per day per variant, so you can see the day your result was distorted by a promotion, an outage or a press mention.
Cumulative view. The running conversion rate with confidence interval bands that narrow as evidence accumulates, plus p-value over time. You can literally watch a result stabilize, or watch it wander and realize you were about to call a coin flip.
We also added hourly visitor counts to the data pipeline, which is what makes this resolution possible in the first place.
6. Combination reports: what happens when experiments collide
This is the feature we are proudest of, and the one nobody else does honestly.
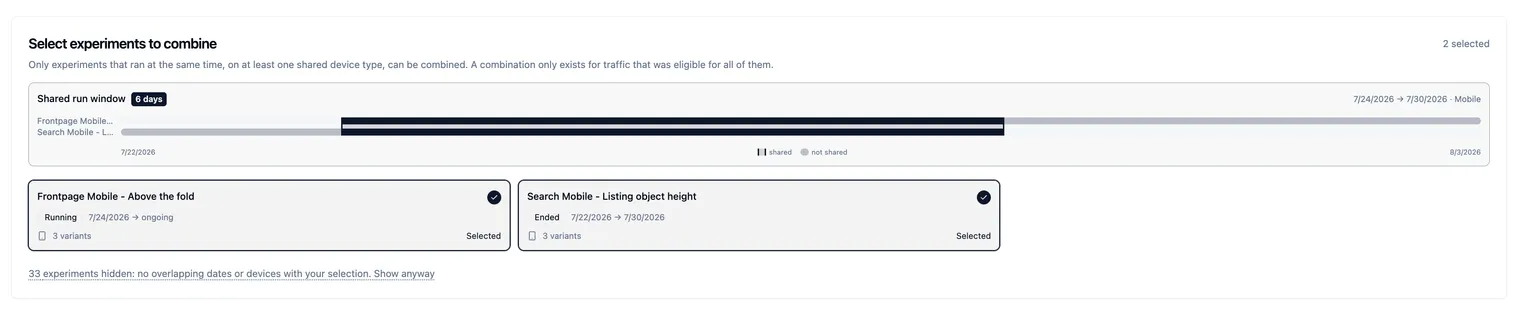
If you run two experiments on the same page at the same time, visitors see both. Standard reporting quietly assumes the two changes do not affect each other. Usually they do not. Sometimes they very much do, and that is exactly the case you need to know about: two changes that each look mildly positive alone can cancel out together, or reinforce each other into something much larger than either.
Combination reports measure that interaction directly. Select two concurrent experiments and Pertento reports:
- Conversions, revenue and average order value for every combination of variants
- An interaction ratio with a 95% confidence interval and a p-value, telling you whether the two changes reinforce, interfere, or are genuinely independent
- The best-performing combination, highlighted
- The four underlying cells behind every number, so nothing is a black box
Two details we want to call out, because they are the difference between a real measurement and a comforting one.
We only count traffic from the period both experiments were actually randomizing. Once you deploy a winning variant, everyone receives it, so the experiment has stopped being an experiment even though it is still being served. We found a pair that looked like a six-day overlap on start and end dates but had zero genuine overlap, because one variant had been deployed a month before the other test began. Including that traffic flipped a verdict from "no finding" to "significant". Pertento now excludes it and tells you plainly when there is no valid window.
We do not report a conversion rate per combination, because it cannot be measured honestly. A rate needs to know how much traffic each combination received, and that is not recoverable. Rather than compute a plausible-looking number from the wrong denominator, we report what the data genuinely supports. The interaction ratio is measurable precisely because traffic allocation cancels out of it mathematically, which means it works across your entire retained history rather than the last couple of weeks.
That is a harder engineering path and a shorter feature list. It is also the only version worth shipping.
7. The implementation pipeline: winners that actually get built
A winning test that never gets permanently coded is worth nothing. So we built the handoff.
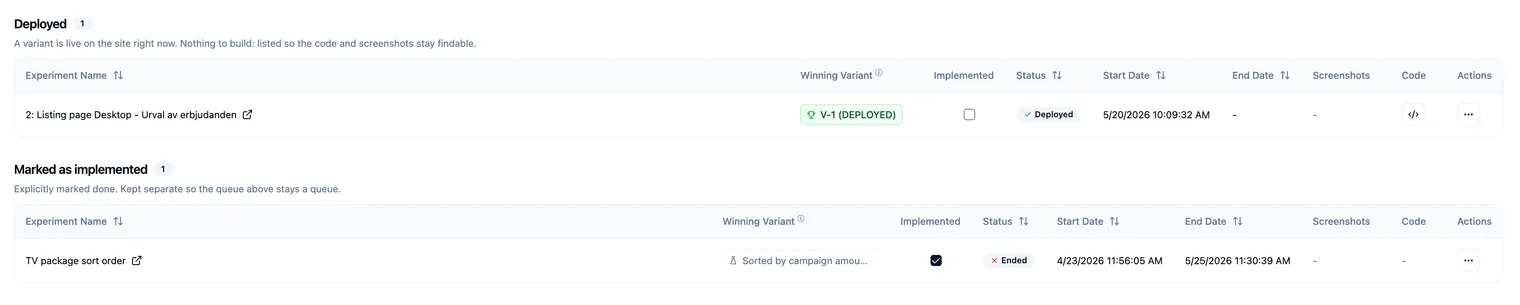
The Implementation page now organizes work into three clear sections:
- 1Needs implementation. Winning variants and previously deployed experiments that are no longer running and have not been marked as implemented. This is your to-do list.
- 2Deployed. Live via Pertento, awaiting permanent implementation.
- 3Marked as implemented. Done, and out of your way.
Every row shows which variant won, prominently, with its uplift. Alongside it:
- Screenshots of the winning variant
- A code view, so a developer can see exactly what the change was
- Email to a developer, sending the full implementation details straight from the dashboard
- CSV export for the teams who live in spreadsheets
- Mark as implemented, to close the loop
The experimentation-to-engineering handoff used to happen in Slack threads and screenshots. Now it happens in the product.
8. Nothing important slips past you: notifications, health monitoring, and a dashboard that flags what needs you
You should not have to sit and watch the account for it to work. This release adds three ways Pertento comes to you when something is worth your attention, so the team stays in the loop without anyone playing lookout.
A notification service that surfaces what matters. Pertento now keeps your whole team on top of what is happening in the account. When an experiment produces a significant result, or anything else of value shows up, the team is notified. You hear about the win when it happens, not the next time someone remembers to open the dashboard.
A health monitor that catches problems early. A companion monitor watches the account for things that might be wrong and need attention, and keeps the team and the user in the loop when they appear. It is the same instinct behind the sample ratio mismatch check, applied across the account: the platform tells you when something looks off, instead of waiting for you to find out the hard way.
A "Needs your attention" section on the dashboard. The dashboard now leads with the things that are actually waiting on you: winning experiments that still need to be implemented, experiments running past their expected end, and problems detected inside running experiments. It is the shortest path from opening Pertento to knowing exactly what to do next.
9. PXL prioritization and hypotheses: decide what to test next
Good experimentation programs are limited by prioritization, not ideas.
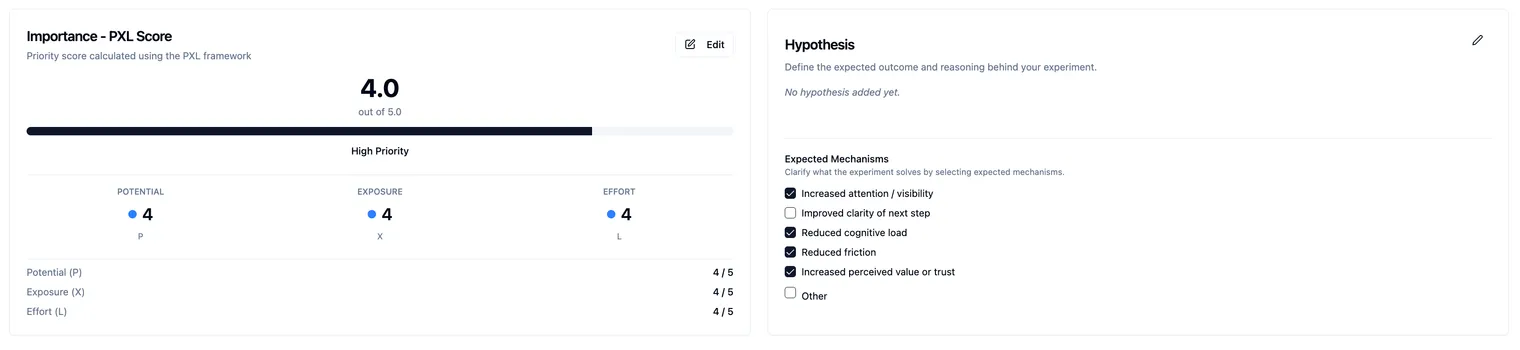
PXL scoring is now built into every experiment. Rate three dimensions on a guided 1 to 5 scale:
- Potential. How much impact could this have?
- Exposure. How many users will actually see it?
- Level of Effort. How much work is it, from hours to months?
You get a single comparable score, so the next test is chosen on merit rather than on whoever spoke loudest in the meeting.
Hypotheses and importance are now first-class fields on the experiment info tab. Write down what you expect and why before you run, which is the difference between an experimentation program and a series of guesses.
10. Underneath: we checked the math
This part is not glamorous, so we will be direct about it.
While building the new statistics engine we audited every existing formula against published reference values. We found and fixed real errors, including one in the core error function used for significance calculations that was off for a small amount of experiments. We also fixed:
- Significance being calculated on a different filter than the table displayed, which could show experiments as "not significant" even when being significant
- Control lookups that were not scoped to the experiment, so a handful of tests were being compared against another variants traffic
- Thirty-one experiments that silently produced no statistics at all due to a data inconsistency
Every formula in the new engine is now pinned by tests against tabulated reference values. The test suite went from 204 tests to 462. If a statistical result changes in the future, a test will fail before a customer sees it.
We would rather tell you we found errors and fixed them than have you quietly acting on them.
Available now
The updated CRO suite is rolling out to all Pertento workspaces. Everything above is live in the dashboard: open any experiment to see the new statistics tab, PXL scoring and hypothesis fields, visit Implementation for the handoff pipeline, check the new Needs your attention section on your dashboard, and select two concurrent experiments to run your first combination report.
Pertento started as a way to run A/B tests. It is now a way to run an optimization program. We would love to hear which of these you reach for first.